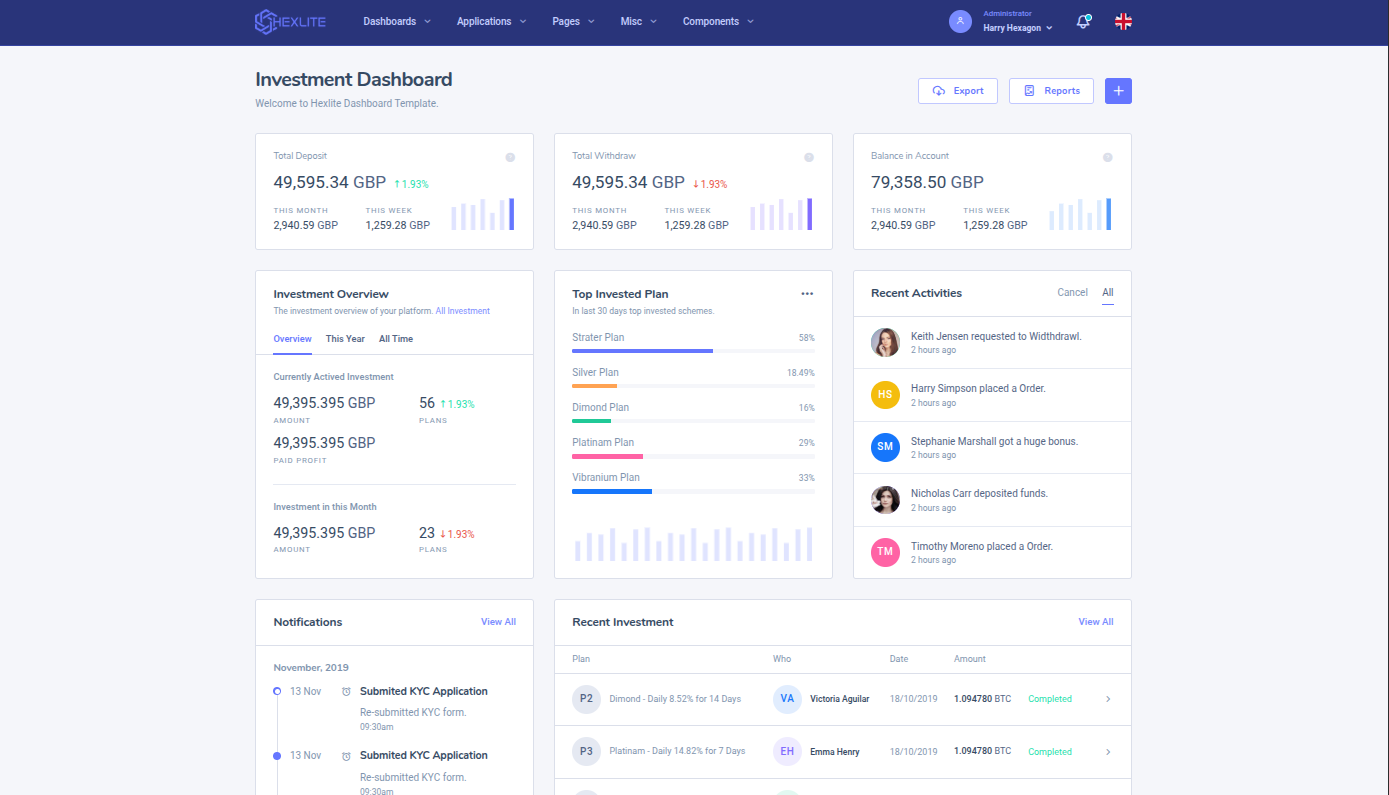
Investment Dashboard
Ideal for CFOs, finance teams, investors, and portfolio managers
This mockup is designed to be your finance command center: a clear, confident way to track investments, manage assets, and make smarter decisions—with zero code plugged in. Think of it as your financial cockpit: data-driven, decisive, and instantly accessible.
Whether you’re monitoring internal projects, venture funds, or a diverse asset mix, this layout puts your most actionable metrics front and center.
Key Features
Portfolio Overview Cards Get your pulse in a glance with total portfolio value, ROI (overall and year-to-date), and number of active investments or holdings.
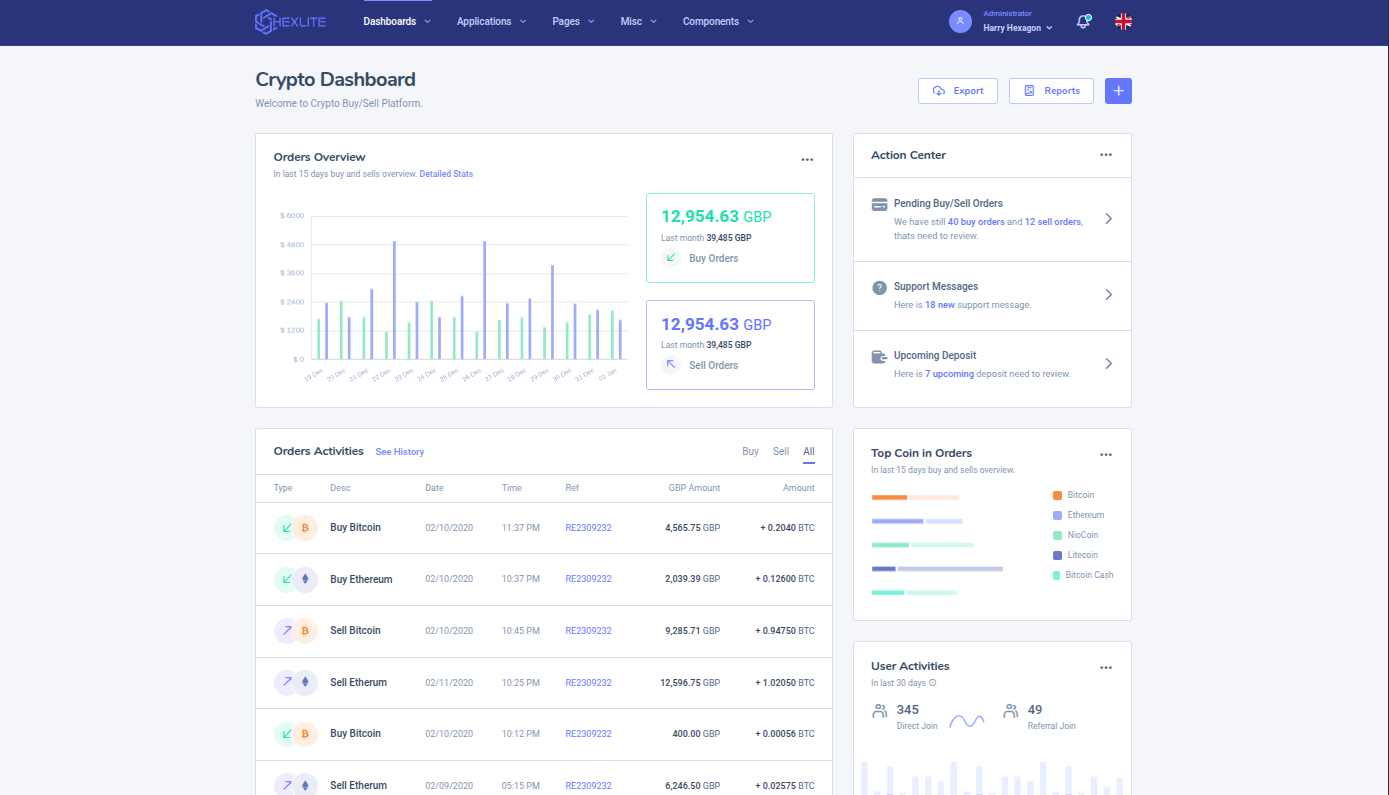
Asset Allocation Breakdown Clean visuals (donut or bar charts) showing investment mix—equities vs fixed income, sectors vs geographies, or company-stage splits. No guessing, just clarity.
Performance Trend Graphs Visualize portfolio growth, monthly returns, or risk-adjusted metrics over time with line or area charts—helpful for trend-spotting and strategy calibration.
Top Performers & Underperformers Highlight standouts—whether best-performers or laggards—so your team can double-down, pivot, or re-allocate capital with confidence.
Use Cases
Perfect for:
- In-house finance or treasury teams tasked with oversight of company investments
- Early-stage investors or VCs tracking startup performance
- Client presentations where fund performance needs to look clean and authoritative
- Companies wanting a daily snapshot of their financial health without diving into spreadsheets
This concept is a modular preview from our HexLite dashboard kit—a curated collection of visual-first ideas designed to guide early planning, inspire insights, and light the path for full builds.